jqPlot
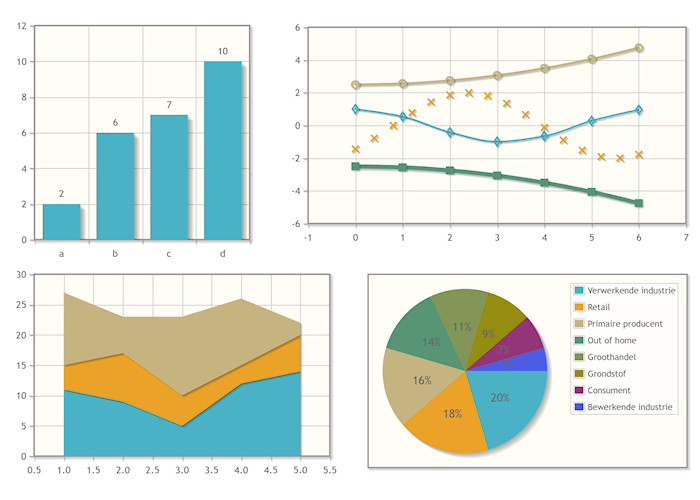
jqPlot is a plotting and charting plugin for the jQuery Javascript framework. jqPlot produces beautiful line, bar and pie charts with many features (http://www.jqplot.com/) . This extension helps you to add jqPlot charts to your website within writing any code!
The data for the charts can be loaded from different data sources (MYSQL, CSV, JSON, MDB).
Features
• Area, Bar, Column, Line, Stacked, Pie and Donut charts..
• Options for zoom, animation, shadow, point labels.
• Support multiple line plots in one chart, with different styles, markers, line width etc.
• Load data from MySQL, CSV, MS Access (MDB) or JSON
Download demo version (save disabled)
jqPlot Extension
Requirements:
WYSIWYG Web Builder 15.1 or higher
jqPlot Extension
Requirements:
WYSIWYG Web Builder 15.1 or higher
Buy full version via 2checkout for $4.95
https://secure.2checkout.com/order/checkout.php?PRODS=40807638
https://secure.2checkout.com/order/checkout.php?PRODS=40807638
EXTENSIONS BUNDLE DISCOUNT
This extension is also part of the Data Extensions Pack 3 which includes 12 extensions for only $19.95!
This extension is also part of the Data Extensions Pack 3 which includes 12 extensions for only $19.95!