Treemap Chart (PAID)
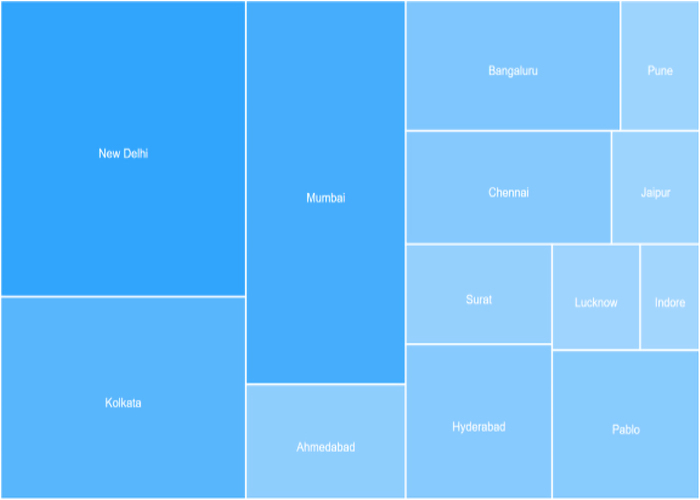
A treemap chart is a data visualization technique that displays hierarchical data in a nested rectangle-based layout. In a treemap, each rectangle represents a hierarchical category, and the size of the rectangle corresponds to a quantitative value, such as a numerical measure or a proportion.
Demo
https://wysiwygwebbuilder.com/support/demos/treemapchart.html
Download demo version (save disabled)
Treemap Chart Extension
Requirements:
WYSIWYG Web Builder 16 or higher
https://wysiwygwebbuilder.com/support/demos/treemapchart.html
Download demo version (save disabled)
Treemap Chart Extension
Requirements:
WYSIWYG Web Builder 16 or higher
Buy full version via 2checkout for $4.95
https://secure.2checkout.com/order/checkout.php?PRODS=46437583
https://secure.2checkout.com/order/checkout.php?PRODS=46437583
EXTENSIONS BUNDLE DISCOUNT
This extension is also part of the Data Extensions Pack 5 which includes 10 extensions for only $29.95!
This extension is also part of the Data Extensions Pack 5 which includes 10 extensions for only $29.95!